TEOS10 implementation
[1]:
import lenapy
import xarray as xr
import numpy as np
import matplotlib.pyplot as plt
[12]:
data=xr.open_dataset('../../data/ecco.nc',engine='lenapyNetcdf')
Global Ocean Heat Content
[23]:
print(data.lnocean.gohc.compute())
<xarray.DataArray 'gohc' ()> Size: 8B
array(5.64697444e+10)
Coordinates:
    time     datetime64[ns] 8B 2010-01-16T12:00:00
    depth    float32 4B 5.0
Attributes:
    long_name:  Global ocean heat content wrt to ocean surface area
    units:      J/m²
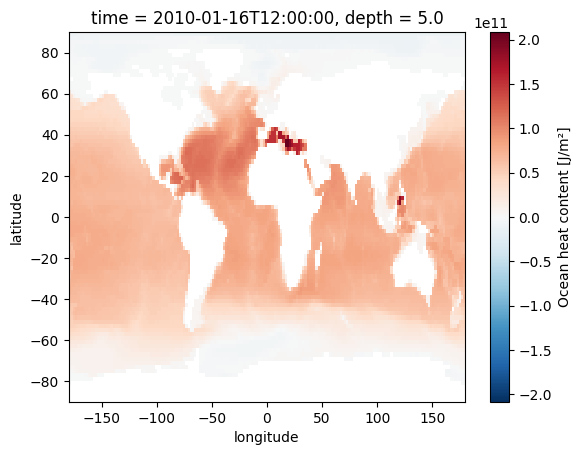
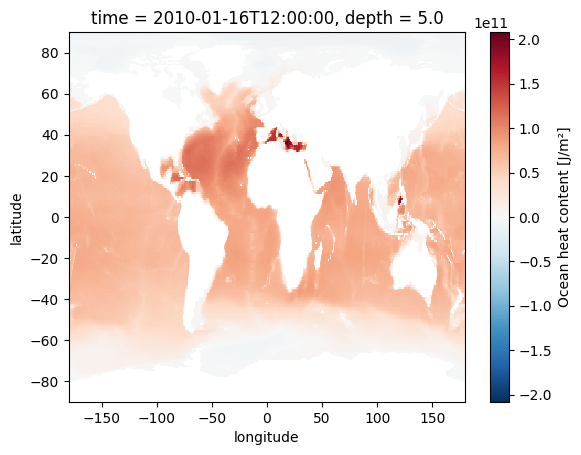
Map of regional OHC
[21]:
data.lnocean.ohc.plot()
[21]:
<matplotlib.collections.QuadMesh at 0x14cf3036cc90>
[3]:
data.lnocean.ohc.plot()
[3]:
<matplotlib.collections.QuadMesh at 0x14a17430fdd0>
Map of regional sea level
[15]:
data.lnocean.ssl.plot()
[15]:
<matplotlib.collections.QuadMesh at 0x14a1472c0ad0>

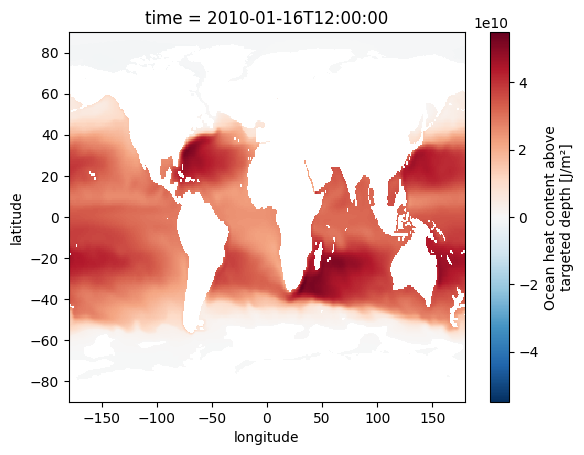
OHC above the isopycne 27
[11]:
depth=data.lnocean.sigma0.lngeo.isosurface(27,'depth')
data.lnocean.ohc_above(depth).plot()
[11]:
<matplotlib.collections.QuadMesh at 0x14a14736a8d0>
[ ]: