Gridded data manipulation
[1]:
import lenapy
import xarray as xr
import numpy as np
import matplotlib.pyplot as plt
[2]:
data=xr.open_dataset('../../data/ecco.nc',engine='lenapyNetcdf')
Ocean mean temperature and salinity
[7]:
data.lngeo.mean(['latitude','longitude','depth'],weights=['latitude','depth']).compute()
[7]:
<xarray.Dataset> Size: 24B
Dimensions:  ()
Coordinates:
    time     datetime64[ns] 8B 2010-01-16T12:00:00
Data variables:
    PT       float64 8B 3.497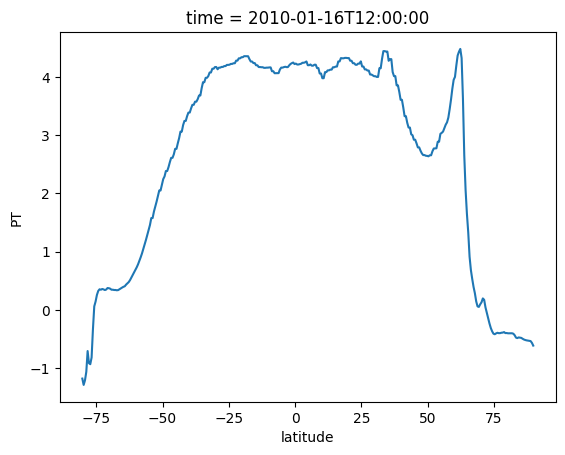
psal float64 8B 34.73Mean zonal potential temperature
[11]:
data.lngeo.mean(['longitude','depth'],weights=['depth']).PT.plot()
[11]:
[<matplotlib.lines.Line2D at 0x14beb69a2110>]
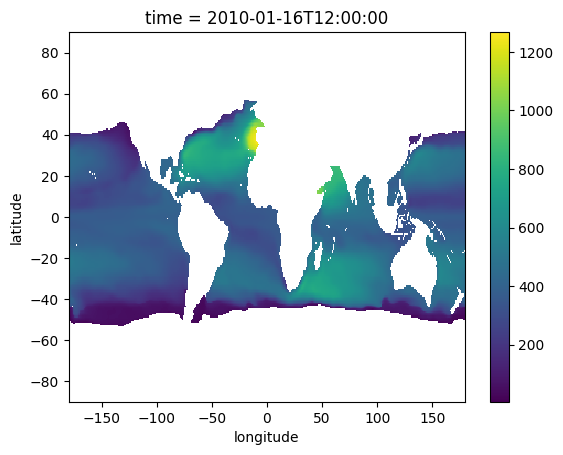
Depth of the 10°C isotherm - isosurface is applied on a Dataset
[14]:
data.PT.lngeo.isosurface(10,'depth').plot()
[14]:
<matplotlib.collections.QuadMesh at 0x14beb6934750>
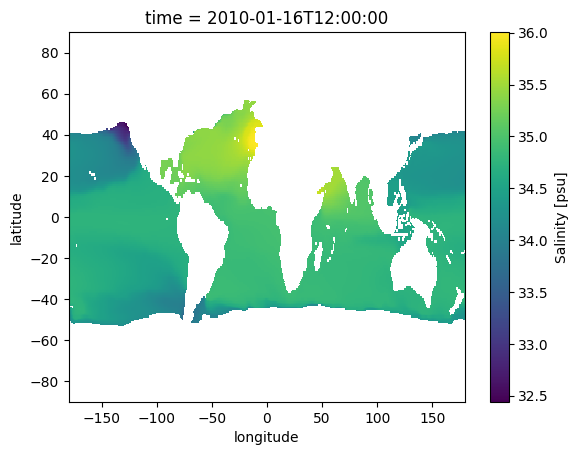
Salinity at the depth of the 10°C isotherm - isosurface is applied to a DataArray
[16]:
data.lngeo.isosurface(dict(PT=10),'depth').psal.plot()
[16]:
<matplotlib.collections.QuadMesh at 0x14beb607af50>
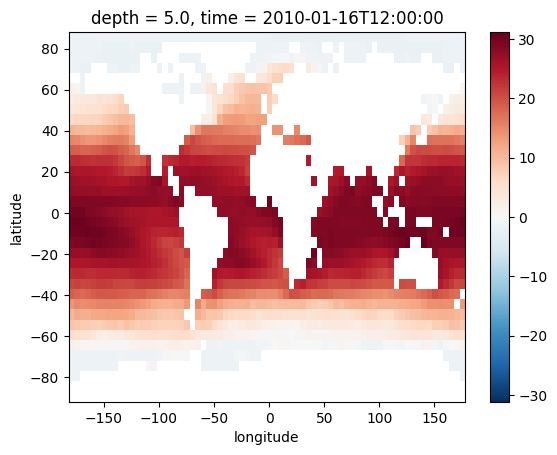
Resampling
[24]:
ds_out = xr.Dataset(
    {
        "latitude":(["latitude"],np.arange(-89.5,90,5.)),
        "longitude":(["longitude"],np.arange(-179.5,180,5.))
    }
)

reg=data.lngeo.regridder(ds_out,method="bilinear")
data.PT.isel(depth=0).lngeo.regrid(reg).plot()
[24]:
<matplotlib.collections.QuadMesh at 0x14beb500fad0>
[ ]: